Using the Shared Centimorgan Chart
A crowdsourced chart that turns shared DNA totals into likely family relationships
The chart most genealogists call the Shared Centimorgan Chart is formally known as the Shared cM Project. It shows how many centimorgans (cM) of DNA people in known relationships actually share, built from tens of thousands of submitted DNA test results rather than theoretical percentages. Genealogists use it by taking the total cM shared with a match and checking which relationship ranges include that number. Landing inside a relationship's range does NOT confirm that relationship. It only narrows the field, since ranges overlap and a single total can fit a dozen or more possible relationships at once.
Where the Chart Came From
Genealogist and attorney Blaine T. Bettinger began collecting the data in 2015, asking genealogists with documented relationships how much DNA they actually shared with that relative. The theoretical expected amount for a first cousin is 12.5 percent, or about 850 cM, but real matches routinely fall above or below it because DNA recombines randomly every generation. Bettinger updated the chart in 2016 and again in August 2017, and starting in September 2017 Jonny Perl of DNA Painter turned the numbers into an interactive tool. The current edition, Version 4.0, went live in March 2020, built from more than 60,000 submissions and analyzed for almost 50 relationships, each with a minimum, maximum, average, and histogram. Perl has refined the tool since, including an August 2022 update that shows where an entered cM value falls within a relationship's histogram.
What Each Box on the Chart Shows
Each relationship box lists the relationship name, the average number of shared centimorgans reported for it, and the range from lowest to highest submission. Clicking a box on the interactive version opens a histogram of the underlying submissions, plus the percentage of submissions above and below any value entered. Keep in mind that for relationships more distant than a half second cousin, the published average counts only matches who shared some detectable DNA. Matches sharing 0 cM are common at that distance, and they are left out of the average entirely. That pulls the published numbers higher than a true population average would run.
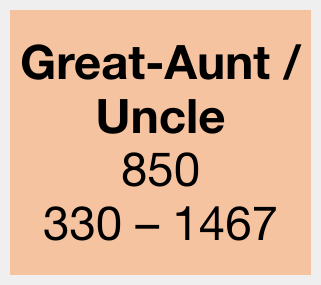
A single relationship box from the tool, showing the average and range for a Great-Aunt/Uncle match. (Image: DNA Painter)
Why the Numbers Cannot Be Taken as Exact
The data is self-reported by genealogists who already knew how they were related, not drawn from a random sample. For close relationships, though, the sheer volume of submissions makes any single bad entry unlikely to skew the range much. The chart also does not account for endogamy or pedigree collapse, and a tester from an endogamous community is often related to a match in several ways at once. Shared DNA can then run higher than the chart expects, sometimes dramatically.
Matching methods vary by company and change over time, too: Family Tree DNA counted segments as small as 1 cM until an August 2021 update raised its threshold to 6 cM. Some totals collected for Version 4.0 in early 2020 may therefore run higher than a comparable match reported today.
Using the Chart With a DNA Match
Start with the total cM shared, not a percentage, and use the interactive version rather than a printed image, since only the interactive tool shows the probability and histogram detail behind each range. A relationship sitting near the edge of its range is possible but uncommon, while one near the average is far more typical. Sometimes the more useful output is not a single closest relationship but the shape of the whole highlighted list, which shared matches, ages, and existing family tree research can then narrow further.
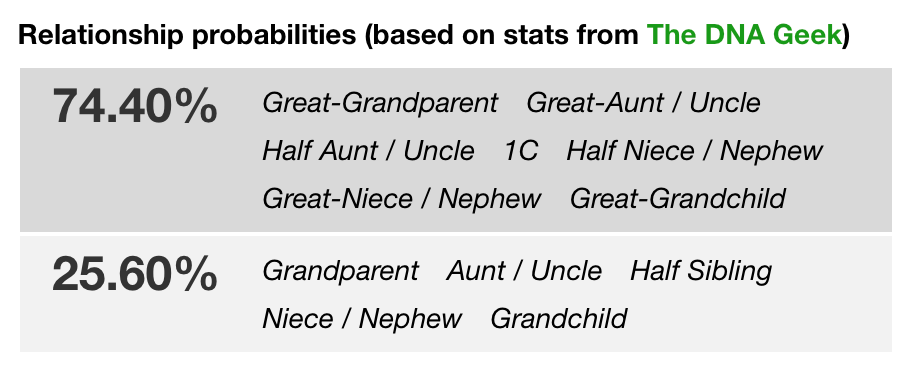
Relationship probabilities for a 1,240 cM match, ranked from most to least likely. (Image: DNA Painter)
Need help finding more records? We have genealogy research services available. You can also try our genealogical records directory which has more than 1.3 million sources to help you more easily locate the available records.
Related Topics
- Learning Genealogy Articles more than 140 helpful articles to help you to do genealogy more effectively